
Cesium 集成 ECharts 航线图(ECharsLayer)
关键引入文件:
- 第一步:引入框架地图关键文件
- https://mhc.ixiera.com/mhc/main_min.js
- https://mhc.ixiera.com/mhc/Cesium-1.120/Build/Cesium/Cesium.js
- https://mhc.ixiera.com/mhc/Cesium3DTile.js
- 第二步:引入 ECharsLayer 类文件
- https://mhc.ixiera.com/mhc/style/echarts5.5.0.min.js
- https://mhc.ixiera.com/mhc/mchmap/EcharsLayer/js/EcharsLayer.min.js
1. 初始化
let chart = new EcharsLayer(viewer, option);
2. 参数说明
一、构造函数/工厂方法参数。
| 参数 | 数据类型 | 是否必填 | 说明 |
| viewer | Object | 必填 | Cesium Viewer 实例 |
| option | Object | 必填 | ECharts 标准配置对象(需包含 series,且每个 series 中 coordinateSystem: 'cesiumEcharts') |
二、option 中常用 series 字段说明。
| 字段 | 类型 | 默认值 | 说明 |
| type | string | - | 系列类型,常用 'lines'(航线)、'effectScatter'(带特效散点)、'scatter'(散点) |
| coordinateSystem | string | - | 必须设为 'cesiumEcharts',否则坐标不会转换 |
| data | Array | - | 数据数组。lines 中格式为 { coords: [[lng, lat], [lng, lat]], value };散点格式为 { name, value: [lng, lat, 数值] } |
| effect | Object | - | 特效配置:show(是否显示)、period(周期秒)、trailLength(拖尾长度)、symbol(模型)、symbolSize(符号大小) |
| lineStyle | Object | - | 线条样式:color、width、opacity、curveness(弯曲度) |
| label | Object | - | 标签:show、formatter('{b}' 显示名称)、position、color、fontSize |
| symbolSize | number/Function | - | 散点大小,可固定或根据数值动态计算 |
| zlevel | number | 0 | 图层叠放顺序,数值越大越靠上 |
三、API 方法
| 方法名 | 参数 | 返回值 | 说明 |
| setChartOption(option) | Object | void | 更新 ECharts 配置并重新渲染 |
| setVisible(bool) | boolean | void | 显式设置显示/隐藏(true 显示,false 隐藏) |
| show() | 无 | void | 显示图层(等同 setVisible(true)) |
| hide() | 无 | void | 隐藏图层(等同 setVisible(false)) |
| remove() | 无 | void | 销毁图层,释放容器 |
4. 使用示例
4.1 基础航线图(流动光点 + 城市节点)
// 定义地理坐标
const geoCoordMap = {
'北京': [116.4, 39.9],
'上海': [121.5, 31.2],
'广州': [113.3, 23.1]
};
// 航线数据
const flightData = [
{ from: '北京', to: '上海', value: 95 },
{ from: '北京', to: '广州', value: 80 }
];
// 转换数据格式
const linesData = flightData.map(item => ({
coords: [geoCoordMap[item.from], geoCoordMap[item.to]],
value: item.value
}));
const scatterData = Object.keys(geoCoordMap).map(name => ({
name: name,
value: [...geoCoordMap[name], 0]
}));
// 构建 option
const option = {
animation: false,
series: [
{
type: 'lines',
coordinateSystem: 'cesiumEcharts',
data: linesData,
lineStyle: { color: '#ffaa00', width: 2, curveness: 0.2 },
effect: { show: true, period: 6, trailLength: 0.7, symbolSize: 3 }
},
{
type: 'effectScatter',
coordinateSystem: 'cesiumEcharts',
data: scatterData,
label: { show: true, formatter: '{b}', position: 'right' },
symbolSize: 8,
itemStyle: { color: '#fff' }
}
]
};
4.2 飞机图标 + 箭头(带 SVG 路径)
const planePath = 'path://M1705.06,1318.313v-89.254...'; // 飞机 SVG
option.series.push({
type: 'lines',
coordinateSystem: 'cesiumEcharts',
symbol: ['none', 'arrow'],
symbolSize: 10,
effect: {
show: true,
period: 6,
symbol: planePath,
symbolSize: 15
},
lineStyle: { color: '#46bee9', width: 1, opacity: 0.6, curveness: 0.2 },
data: linesData
});
4.3 多城市航线(自动收集所有节点)
// 将多个数据源(如 BJData, SHData)合并,自动去重生成散点
// 参考封装好的 buildOption 函数(可自行实现)
const option = buildOption(rawData); // 内部自动生成 series
EcharsLayer.create(viewer, option).then(chart => { ... });
4.4 显示控制
// 隐藏
chart.hide();
// 显示
chart.show();
// 切换
chart.setVisible(!chart.visible);
4.5 更新数据
// 修改 option 后重新设置
const newOption = { ... };
chart.setChartOption(newOption);
4.6 销毁图层
chart.remove();
5. 完整代码实例
<script src="https://mhc.ixiera.com/mhc/main.js"></script>
<script src="https://mhc.ixiera.com/mhc/Cesium-1.120/Build/Cesium/Cesium.js"></script>
<script src="https://mhc.ixiera.com/mhc/Cesium3DTile.js"></script>
<script src="https://mhc.ixiera.com/mhc/style/echarts5.5.0.min.js"></script>
<script src="https://mhc.ixiera.com/mhc/mchmap/EcharsLayer/js/EcharsLayer.min.js"></script>
<style>
html,body,#cesiumContainer { width:100%; height:100%; margin:0; padding:0; overflow:hidden; }
.btns { position:fixed; top:10px; left:10px; z-index:1000; display:flex; gap:8px; flex-wrap:wrap; }
.btns button { background:#fff; border:1px solid #ccc; border-radius:4px; padding:5px 12px; cursor:pointer; font-size:12px; }
</style>
<div id="cesiumContainer"></div>
<div class="btns">
<button onclick="remove()" >注销</button>
<button onclick="setChartOption()"> 更新</button>
<button onclick="show()">显示</button>
<button onclick="hide()">隐藏</button>
</div>
<script>
const view3D = MchCesium.init('cesiumContainer', true);
const viewer = MchCesium.viewer;
viewer.camera.setView({ destination: Cesium.Cartesian3.fromDegrees(116.4, 39.9, 8000000) });
let chart = null;
// 准备数据
const geoCoordMap = {
'北京': [116.4, 39.9],
'上海': [121.5, 31.2],
'广州': [113.3, 23.1],
'成都': [104.1, 30.6],
'哈尔滨': [126.7, 45.8]
};
const flightData = [
{ from: '北京', to: '上海', value: 95 },
{ from: '北京', to: '广州', value: 80 },
{ from: '上海', to: '广州', value: 70 },
{ from: '北京', to: '成都', value: 60 },
{ from: '哈尔滨', to: '广州', value: 50 }
];
function buildOption() {
const linesData = flightData.map(item => ({
coords: [geoCoordMap[item.from], geoCoordMap[item.to]],
value: item.value
}));
const scatterData = Object.keys(geoCoordMap).map(name => ({
name: name,
value: [...geoCoordMap[name], 0]
}));
const planePath = 'path://M1705.06,1318.313...';
return {
series: [
{
type: 'lines',
coordinateSystem: 'cesiumEcharts',
data: linesData,
lineStyle: { color: '#ffaa00', width: 0, curveness: 0.2 },
effect: { show: true, period: 6, trailLength: 0.7, color: '#fff', symbolSize: 3 }
},
{
type: 'lines',
coordinateSystem: 'cesiumEcharts',
data: linesData,
symbol: ['none', 'arrow'],
symbolSize: 10,
lineStyle: { color: '#ffaa00', width: 1, opacity: 0.6, curveness: 0.2 },
effect: { show: true, period: 6, trailLength: 0, symbol: planePath, symbolSize: 15 }
},
{
type: 'effectScatter',
coordinateSystem: 'cesiumEcharts',
data: scatterData,
label: { show: true, formatter: '{b}', position: 'right', color: '#fff', fontSize: 13 },
itemStyle: { color: '#fff', shadowBlur: 10 },
symbolSize: 8,
rippleEffect: { brushType: 'stroke' }
}
]
};
}
chart = new EcharsLayer(viewer, buildOption());
function remove(){
if(chart) chart.remove(); chart1 = null;
}
// 更新
function setChartOption(){
if(chart) chart.setChartOption(option2);
}
function show(){
if(chart) chart.show();
}
function hide(){
if(chart) chart.hide();
}
</script>
6. 效果展示
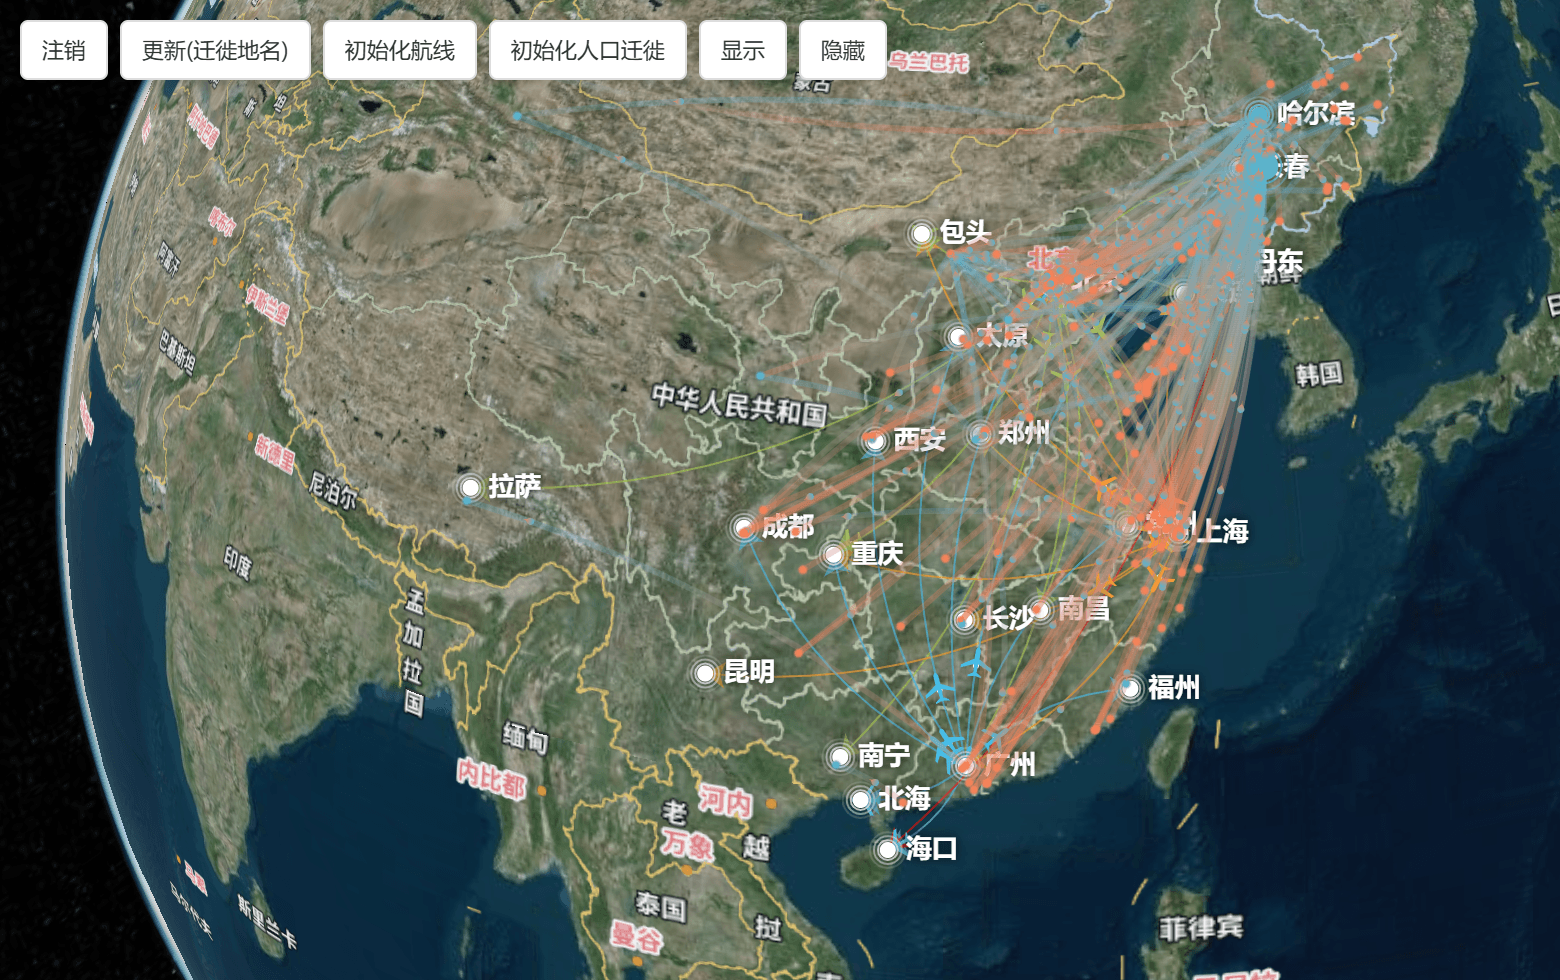
Demo地址:https://mhc.ixiera.com/mhc/mchmap/EcharsLayer/index.html

 返回顶部
返回顶部

 热线电话
热线电话

 微信
微信
 扫一扫
扫一扫